 Web Design · Healthcare · Booking
Ergoterapistimle
Tested: · Google PageSpeed Insights
$ open_report →Website speed optimisation is the work of measuring where a site loses time and fixing the server response, images, code and third-party scripts so that pages load and respond faster. We work on custom PHP, Node.js and Next.js, static HTML, e-commerce and WordPress sites, measuring both lab and real-user field data against Google's thresholds: LCP 2.5 s, INP 200 ms, CLS 0.1.
Website speed optimisation is for any site that loads slowly and is losing visitors, sales or search visibility because of it, whatever it is built on. Slowness rarely has a single cause; it usually comes from a slow server response, heavy images and scripts that load one after another. That is why we measure which layer weighs most before changing anything.
We use the same measurement method for a brochure site, a custom-built portal or a shop with thousands of products; on shops, category, product and checkout templates are treated separately.
Because the two measure different things: Lighthouse is a lab test that emulates one device and one connection, while field data (CrUX) is the experience of real Chrome users on your site over the previous 28 days. Google uses field data in Search Console and in its page experience assessment.
So a site can score 100 in Lighthouse and still fail in the field. The most common reason is INP: the lab test never taps the menu, but when a real user does, a heavy JavaScript task locks the page. Older phones and weak mobile connections are invisible in the lab as well. We measure both and report them side by side.
| Metric | What it measures | Google's "good" threshold |
|---|---|---|
| LCP | Time until the largest content element is rendered | ≤ 2.5 s |
| INP | Delay in responding to taps and clicks | ≤ 200 ms |
| CLS | Visual shifting while the page loads | ≤ 0.1 |
The thresholds apply at the 75th percentile of visits, so at least three in four visits must stay within them. Details are in Google's Core Web Vitals guide and the PageSpeed Insights documentation.
The work runs on two layers: the server decides how quickly the first byte arrives, and the front end decides how quickly that content becomes usable on screen. The table below shows what a one-off page speed optimisation includes and what stays outside it.
| Work | Status |
|---|---|
| Server response time (TTFB) analysis, page and object caching | Included |
| HTTP/2 or HTTP/3, Brotli/gzip compression, browser cache headers | Included |
| Converting images to AVIF/WebP, correct sizing and lazy loading | Included |
| Inlining critical CSS and removing unused CSS | Included |
| JavaScript splitting, defer/async and fixing interaction delay (INP) | Included |
| Font loading: subsetting, preload and font-display | Included |
| Delaying analytics, chat and advertising scripts | Included |
| Before-and-after report with lab and field data | Included |
| Changing hosting and migrating the site | Quoted separately |
| Rebuilding the design or application from scratch | Not included |
| Hosting, CDN and third-party subscription fees | Not included |
If the hosting itself is the bottleneck, the measurement shows it and we recommend a move as a separate step under Website & Hosting Migration.
There are four steps and a typical site takes 3 to 5 working days in total; for large shops and custom applications the timeline is written into the quote after measurement. We work on a copy of the site (staging), take a backup first and release changes to the live site during low-traffic hours.
Lab tests, CrUX field data and server response time are measured per template (home, listing, detail, checkout); a bottleneck list and target score are drawn up
Caching, compression, HTTP/2-3, slow database queries and application response time are addressed
Images, critical CSS, JavaScript bundles, fonts and third-party scripts are reworked
The same pages are measured over several runs with the same method and a before-and-after table using the median is delivered
We work on custom PHP applications, Node.js and Next.js projects, static HTML sites, front ends fed by REST APIs, e-commerce sites and WordPress. Each platform has its bottleneck in a different place, so we apply measurement rather than a fixed recipe.
If your site runs on WordPress, see our WordPress Speed & Performance page for plugin, theme and database specifics. On closed platforms such as Wix, Shopify or Squarespace there is no server access, so our scope is limited to images, scripts and content structure; we say so in the first audit. If speed should be handled together with crawlability and indexing, the work can be combined with Technical SEO.
Four variables set the price: the platform, the number of page templates to measure, the level of server access and how many third-party scripts the site carries. On a static brochure site the work mostly stays at image and CSS level, whereas a custom application needs work on database queries and server code. That is why we quote from measurement rather than a fixed price list.
The first audit is free and its report is shared with you; the quote is fixed after the audit and does not rise later. A target score is written into the quote, and if we do not reach it you are not charged the difference. Because field data builds up over a 28-day window, we carry out a free check measurement three months after delivery.
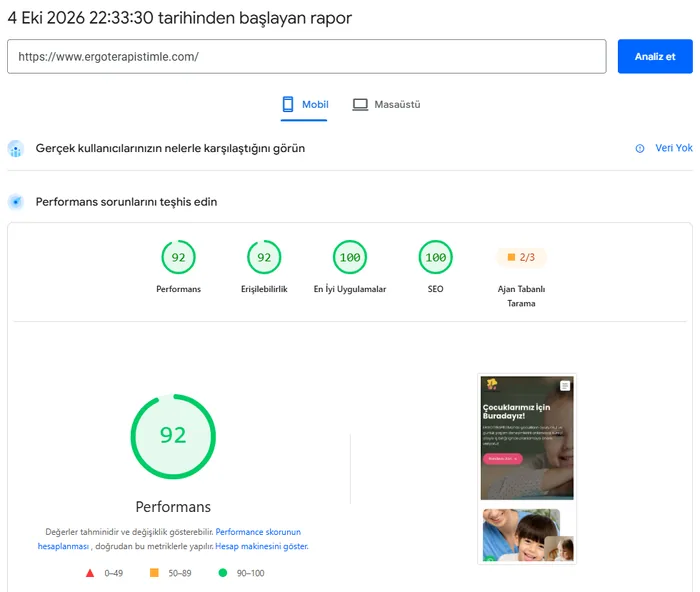
On the sites we build, speed is part of the design rather than a setting added afterwards. The scores below are PageSpeed Insights measurements taken on 4 October 2026; the cards below link to the reports themselves, and you can test the same pages yourself today.
Lab scores fluctuate from run to run, so we measure several times and report the median; your report uses the same method. An animated site scoring 100 on mobile shows that speed does not require giving up visual richness.
Any improvement made without measuring what slows the site down is a guess; we measure first and change things second.
The work is led by Caner Zep Çelik, Founder & Technical Consultant of Zep Bilişim. Since 2020 he has worked on more than 100 projects for clients in the United Kingdom, Turkey and Germany; he carries out the measurement and diagnosis himself and does not subcontract the work.
If all three metrics are green in your field data, website speed optimisation is unnecessary, and we tell you so in the first audit rather than selling work. If only the admin area is slow, visitors are not affected and a smaller fix will do. If the design and codebase are fundamentally outdated, optimisation has limits; in that case a Website Redesign may be the better investment.
The sites below are sites we built, all listed in our references. Scores come from Google PageSpeed Insights; each card shows the test date and links to the report itself.
Web Design · Healthcare · Booking
Tested: · Google PageSpeed Insights
$ open_report →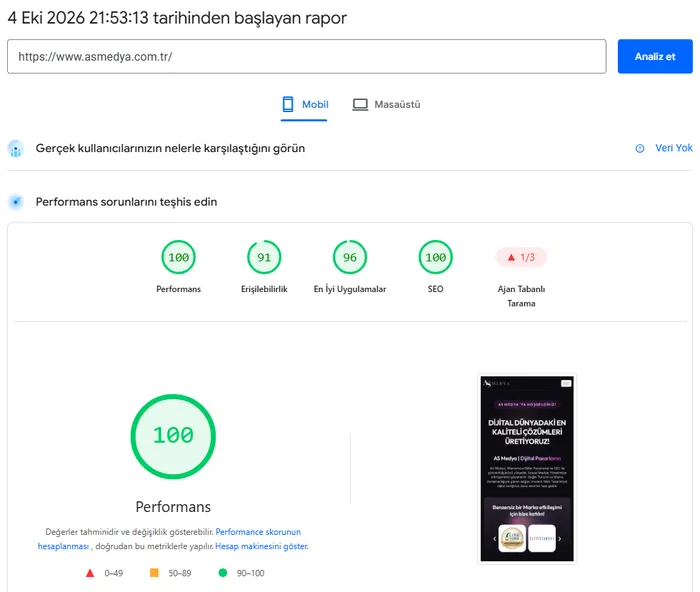 Agency · Digital Marketing
Tested: · Google PageSpeed Insights
$ open_report →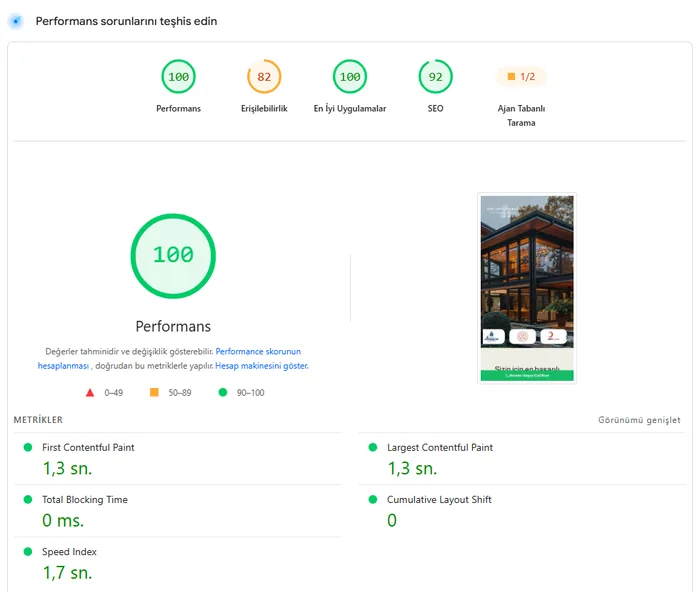 Multilingual · Construction
Tested: · Google PageSpeed Insights
$ open_report →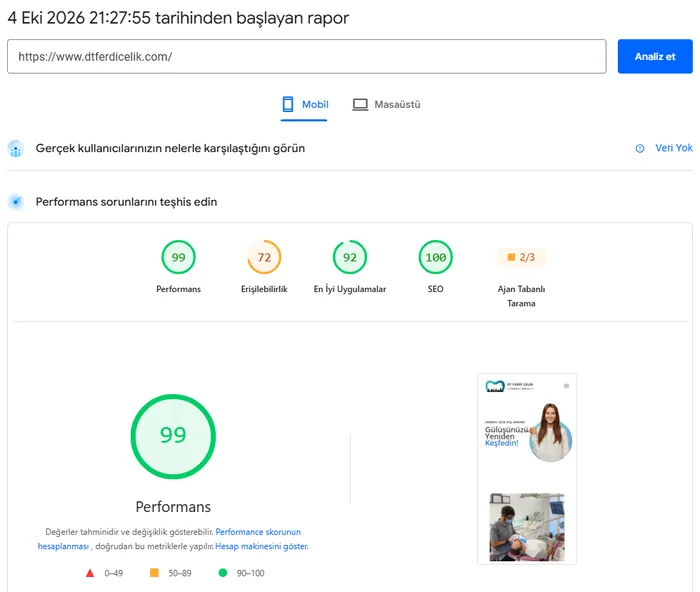 Multilingual · Healthcare
Tested: · Google PageSpeed Insights
$ open_report →PageSpeed lab scores can vary by a few points between runs; if you re-run the analysis from the report you may see a different value. The values on the cards belong to the test on the stated date.
The most reliable way to test website speed is to use PageSpeed Insights together with the Core Web Vitals report in Search Console. PageSpeed Insights shows real-user field data at the top and a Lighthouse lab test below. Lab scores vary between runs, so do not rely on a single test; measure the same page several times and look at the median.
Yes, Core Web Vitals are part of Google's page experience signals, but relevance of content always carries more weight. Speed on its own does not bring rankings; it makes a difference between pages of similar quality and reduces visitors leaving before the page loads. That is why we never promise rankings and instead set measurable targets for LCP, INP and CLS.
A website is usually slow for four reasons: a slow server response, oversized images, render-blocking CSS and JavaScript, and third-party scripts such as chat, analytics or advertising. Which one dominates depends on the site. Installing a plugin or switching hosts without measuring first may leave the real bottleneck untouched, which is why every project starts with a measurement.
No, a score of 100 is not required; what matters is that real-user data stays within LCP 2.5 seconds, INP 200 milliseconds and CLS 0.1. A site with a lab score of 85 can pass every threshold in the field, while a site scoring 100 can still fail on INP. That is why our quotes set targets for both the lab score and the field metrics.
For a typical site, website speed optimisation takes 3 to 5 working days: one day of measurement, one day on the server layer, one to two days on the front end and half a day of re-measurement. For shops with thousands of products and custom applications, the timeline is set in the quote. Field data improvements take several weeks to appear in Search Console.
Changing hosting only makes a clear difference when the bottleneck is the server response, in other words when TTFB is high. If the problem is heavy images or JavaScript, a more powerful server will not fix it. We therefore measure first; if the slowness is server-side we recommend a migration as a separate step, otherwise we advise you to stay with your current host.
Speed work dedicated to slowness caused by WordPress plugins, themes and databases.
View details → SEO OptimisationA technical audit covering crawlability, indexing, structured data and Core Web Vitals together.
View details → Website Maintenance & SupportA planned move to more suitable hosting when the server is the cause of the slowness.
View details →Written by: Caner Zep Çelik, Founder & Technical Consultant · Last updated: